
Fortnightly Budget Plus is a fortnightly budget spreadsheet for Australian households, built in Excel. Set a budget for each category, then compare it with what you actually spent. Type your spending in, or import your transactions and let the spreadsheet sort them for you. See the results per week, fortnight or month, or across your whole statement period.
This is where you start. Not sure what your bills are? Try the household bills checklist.
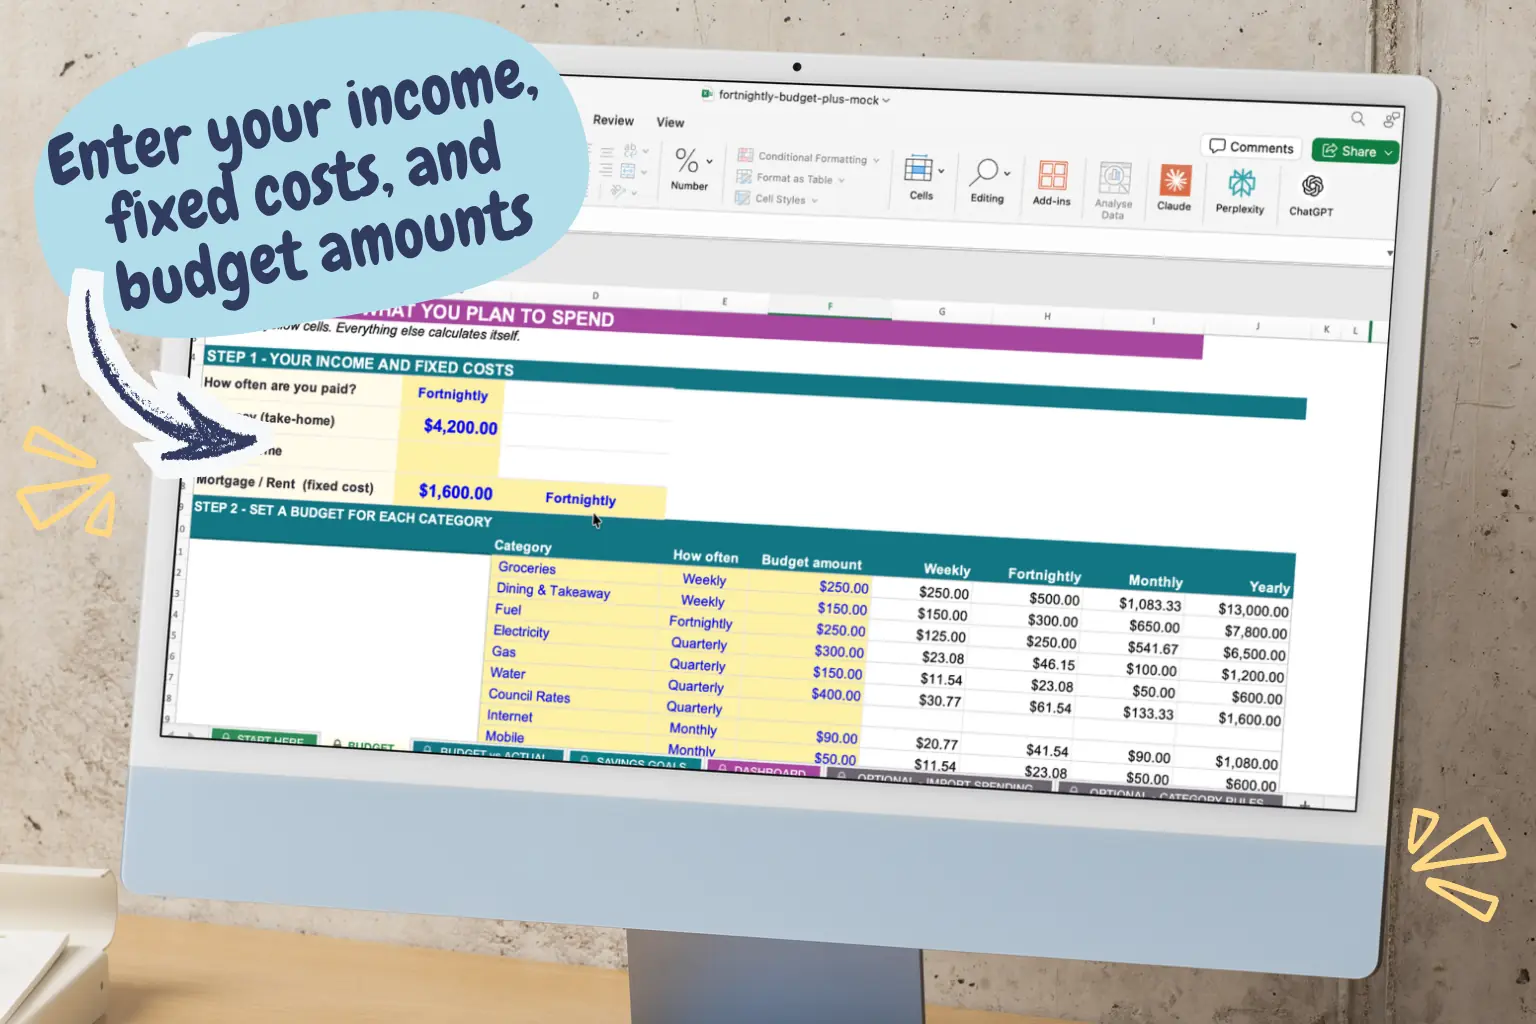
Your pay, your rent and what you want to spend on each item. Pick how often you pay each one.
Type in what you spent, or import your transactions and let the spreadsheet sort them for you.
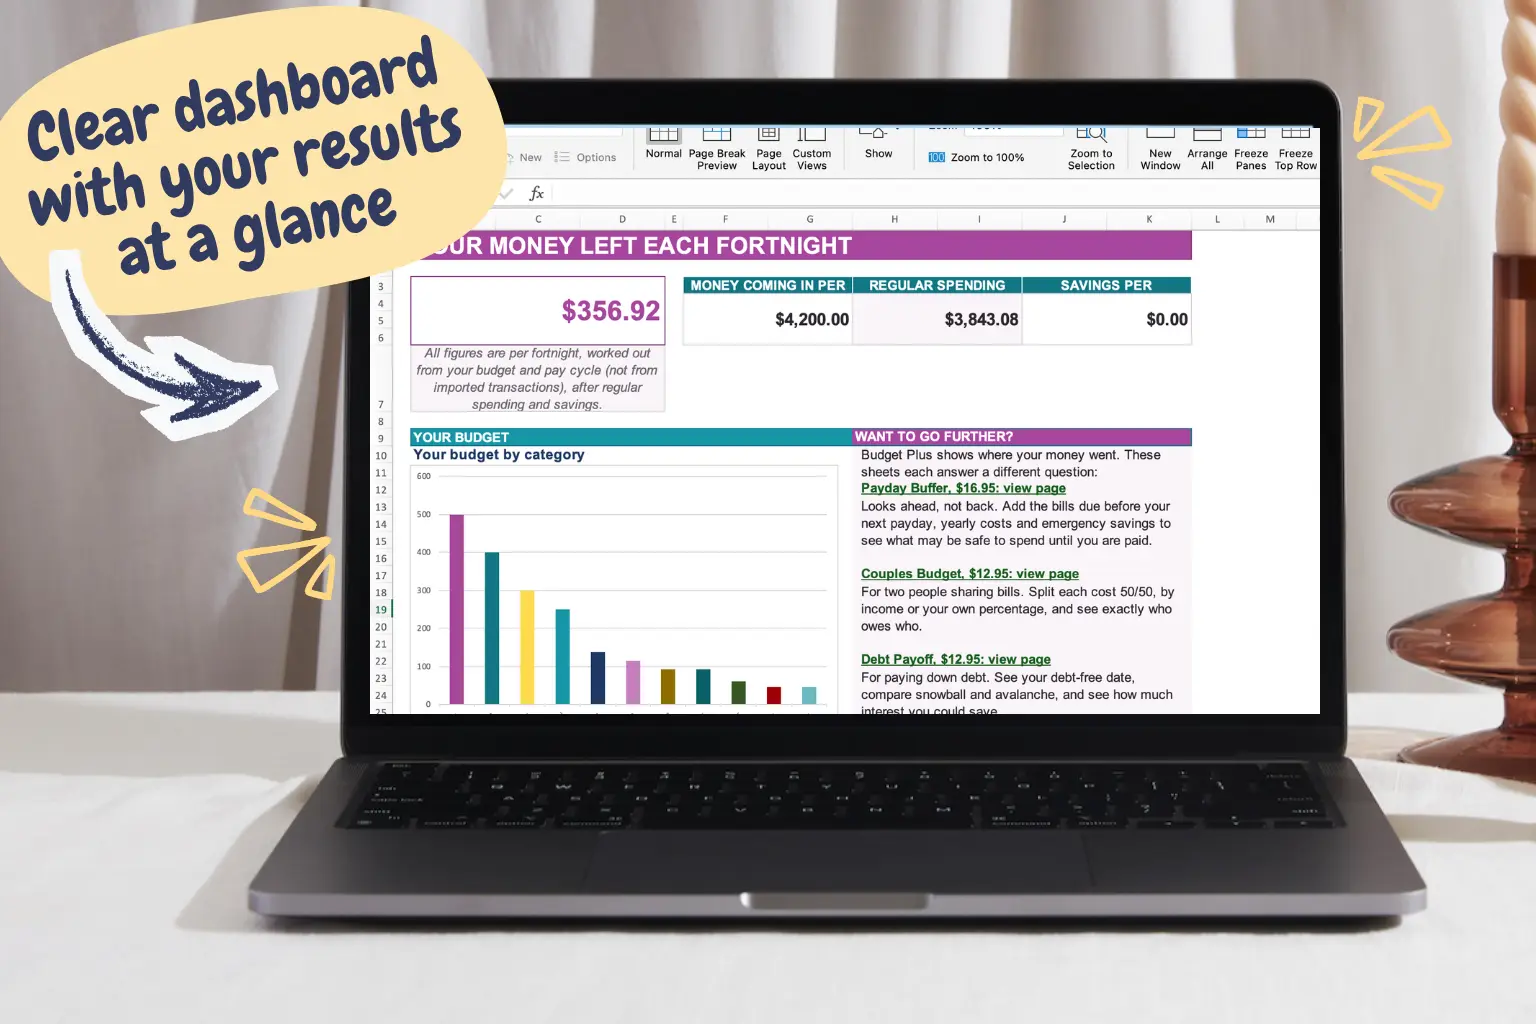
See what is left each fortnight and where your money went.
Saving for something? Add your goals on the SAVINGS GOALS tab. It works out how much to set aside each fortnight and week.
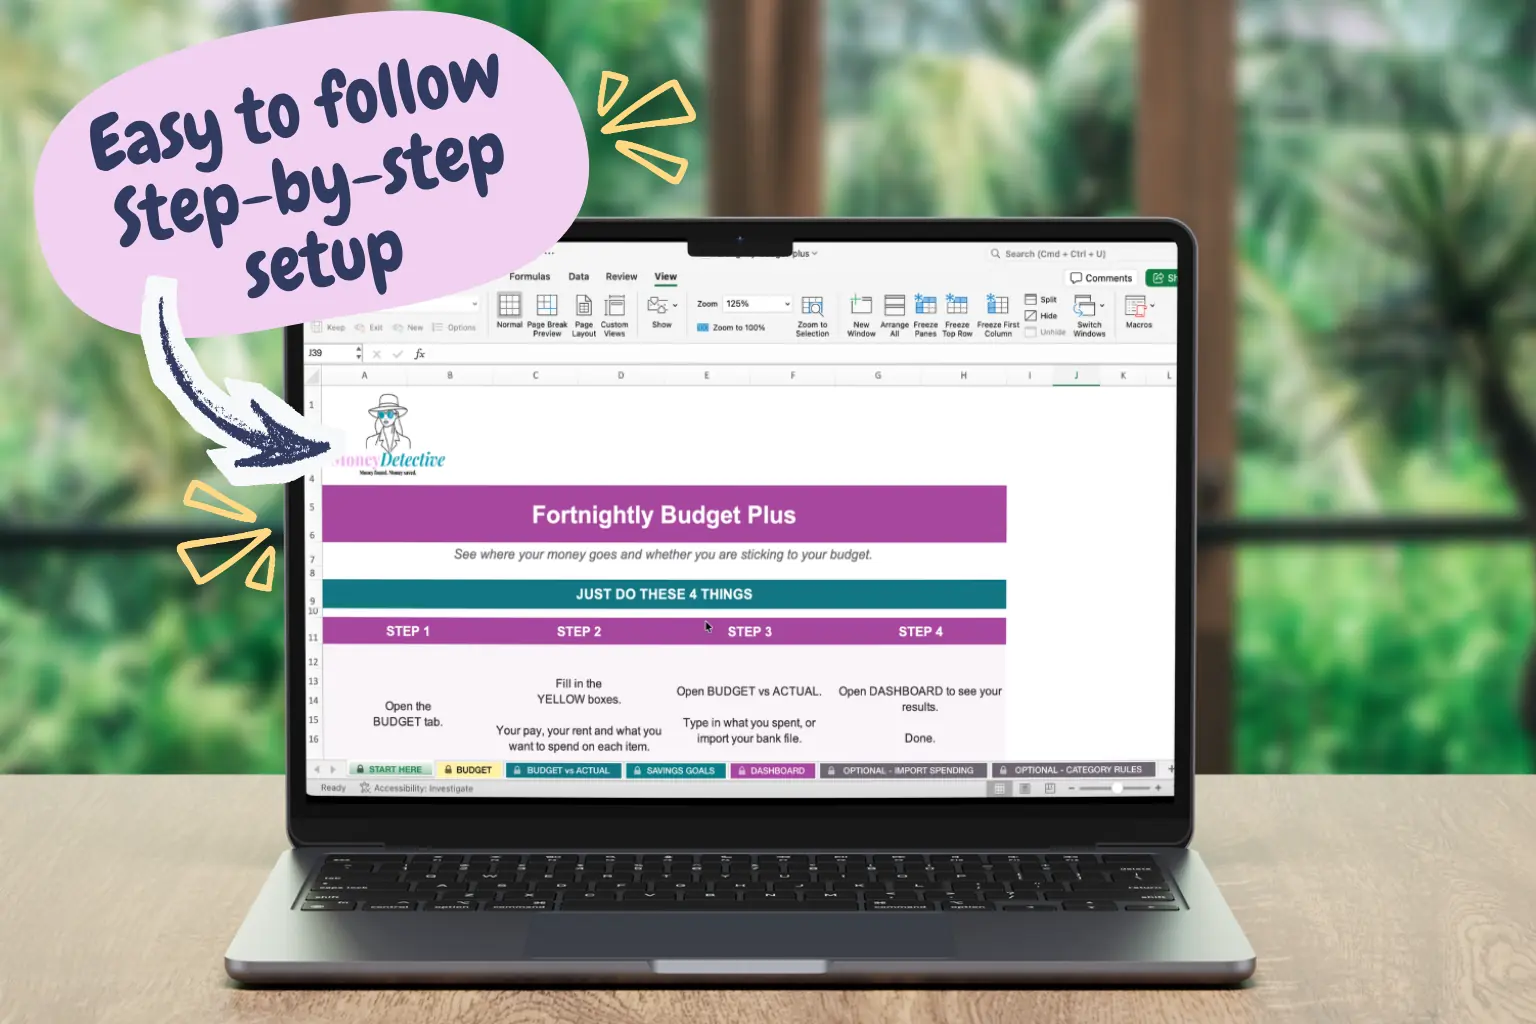
Example figures only. They are made up to show how Budget Plus works and are not from a real customer.
Say your take-home pay is $2,800 a fortnight. On the BUDGET tab you enter your pay and a budget for each category. Then, at the end of the fortnight, you type what you actually spent into the yellow column on BUDGET vs ACTUAL (or import your transactions instead).
| Category | Your plan | What you spent | What Budget Plus shows |
|---|---|---|---|
| Groceries | $420 a fortnight | $468 | Over budget: $48 over, 111% used |
| Dining & Takeaway | $120 a fortnight | $96 | Under budget: $24 under, 80% used |
| Fuel | $150 a fortnight | $138 | Under budget: $12 under, 92% used |
Bills that do not arrive every pay. Enter your electricity bill as $390 a quarter and Budget Plus converts it to $60 a fortnight ($390 × 4 quarters ÷ 26 fortnights), so each pay budget carries its share.
Spotting the differences. Each category is marked Over budget, Under budget or In line (within 5% of your plan). The Largest Differences Over Budget list then ranks the categories that went over, so groceries comes first here, $48 over, which is about $24 a week.
A savings goal, kept separate. On the SAVINGS GOALS tab you add a holiday with a $1,300 target, wanted in 26 weeks, with nothing saved yet. Budget Plus shows $50 to set aside each week, or $100 each fortnight. That $100 is kept apart from your spending figures, so it does not change your budget vs actual.
Illustrative figures only. Your own results depend on your budget and what you spend.
Three short screen recordings of the real workbook in Excel, with example figures. Press play to watch. Each one has a written description underneath.
Compare your budget with real spending, spot the categories that are over or under, and switch between your whole statement period and weekly, fortnightly or monthly figures.
A screen recording of the BUDGET vs ACTUAL tab in Excel. The view is set to Whole Statement Period, showing the budget, the actual spending and the difference across all the imported dates. A table marks each category as under budget, in line or over budget, and lists the largest single cost in each. A panel lists the largest differences over budget and reconciles the imported transactions. The view is then switched between weekly, fortnightly and monthly figures.
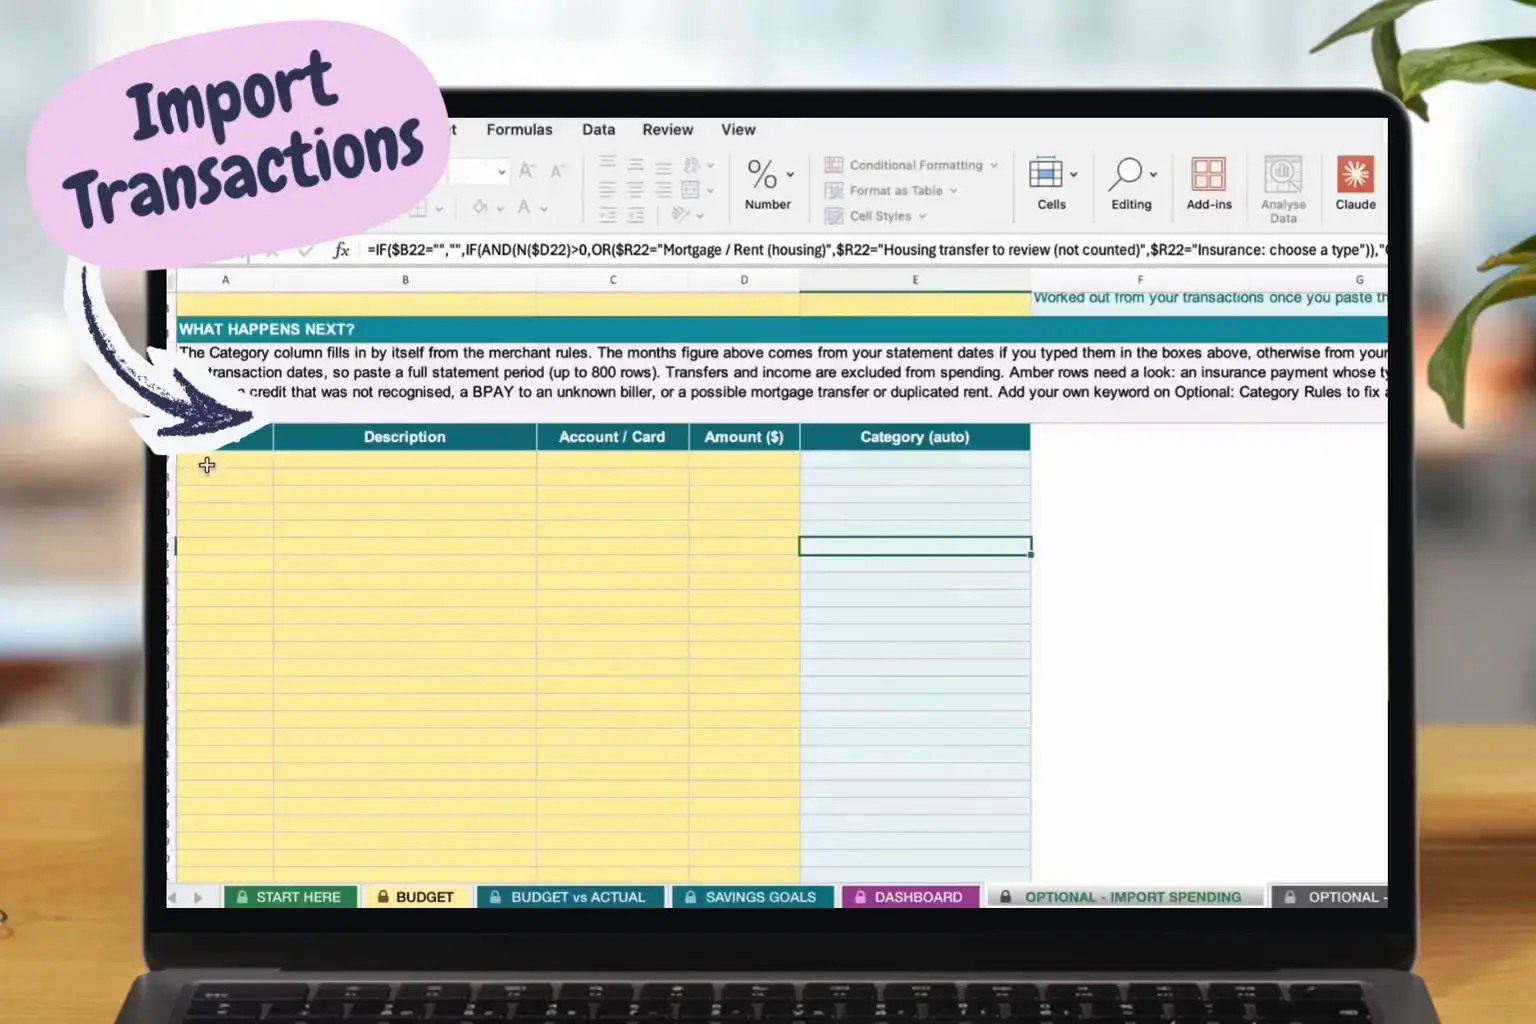
Convert a PDF statement, paste the rows in, and watch each transaction land in a category. Check the sorted rows, and add one keyword to fix any that land in the wrong category in future imports.
A screen recording showing the OPTIONAL - IMPORT SPENDING tab, the free Bank Statement Converter and the result. A statement is converted to 30 transaction rows, which are copied and pasted into the yellow import table. The Category column fills in automatically. One payment is flagged as needing a fix, a keyword is added on the OPTIONAL - CATEGORY RULES tab, and the category updates. The data shown is example data.
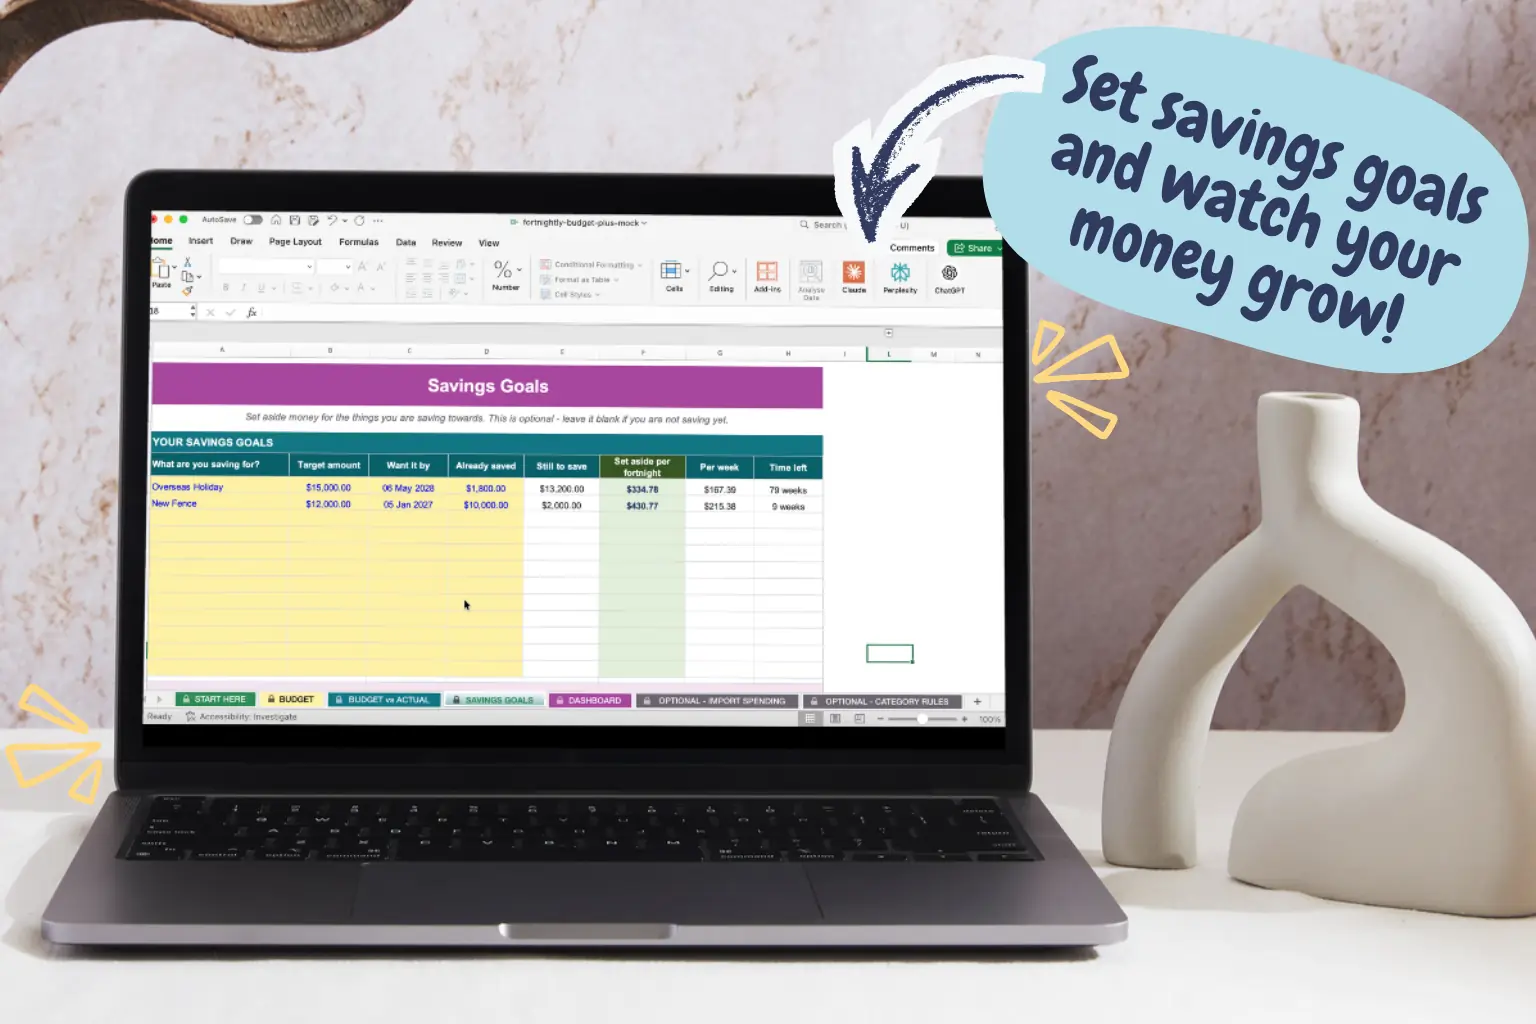
Add a goal, a target and a date, and see how much to set aside each fortnight and each week.
A screen recording of the SAVINGS GOALS tab in Excel. A new goal is typed in with its target amount and the date it is wanted by. The tab shows the amount still to save, the amount to set aside each fortnight and each week, and the time left, and the totals row updates as goals are added.
One-off purchase. No subscription.
Over 30 categories, from groceries and council rates to kids, celebrations, hobbies and loans. Rename any category to suit your household, and use the spare lines for anything that is missing.
Enter each cost as weekly, fortnightly, monthly, quarterly or yearly. Budget Plus shows it per week, fortnight, month and year, so you are not doing the sums.
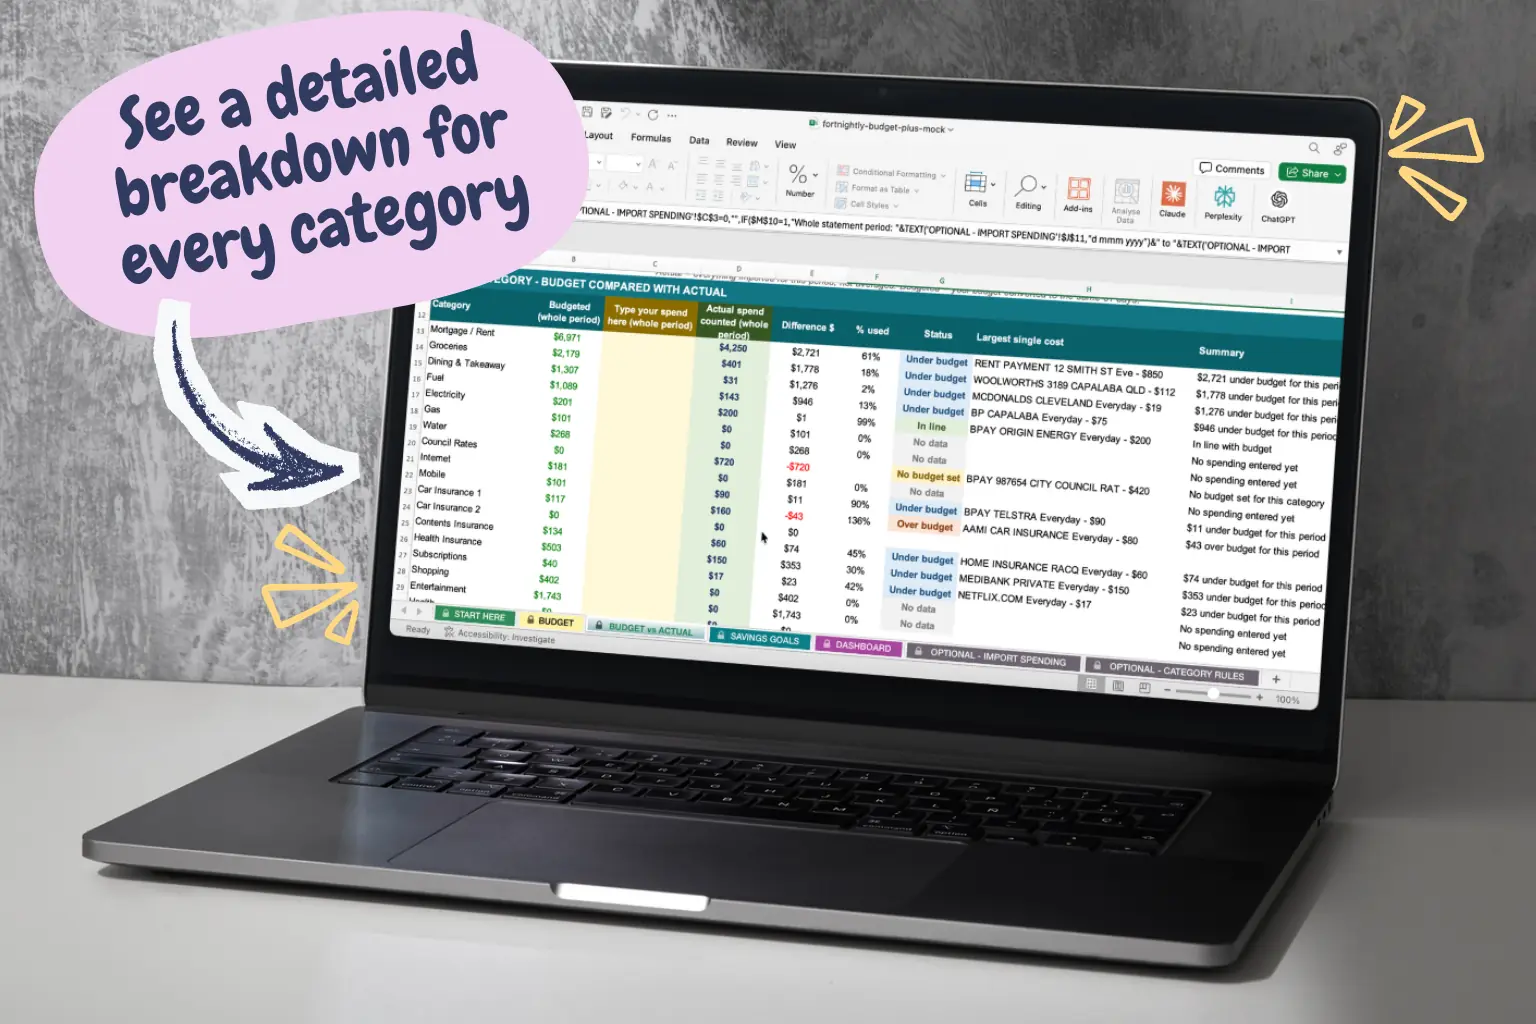
Each category shows your budget, your actual spending, the difference, the percentage used and a status. A list of the biggest differences over budget shows where to look first.
Import is optional. Type your own spending into the yellow "Type your spend here" column, or import transactions and the actual figures fill in. Choose Whole Statement Period to see the actual totals for the dates you imported, or an average per week, fortnight or month.
A reconciliation panel shows how your imported transactions were counted, so you can check nothing has gone missing.
Convert a PDF statement with the free Bank Statement Converter, or paste a CSV from your bank. Up to 800 transactions are sorted into your budget categories using built-in merchant keywords.
The number of months in your statement is worked out for you from the dates.
Type the goal, the target amount, the date you want it by and what you have already saved. Budget Plus shows how much is still to save, how much to set aside each fortnight and each week, and how long is left.
Savings goals are kept separate from your spending figures, so they never distort your budget vs actual.
The example figures are only there to show how it works. Everything you type goes into the yellow boxes, and nothing connects to your bank.
| Free Fortnightly Budget | Budget Plus | |
|---|---|---|
| Categories | 23 budget categories | Over 30 categories you can rename, plus spare lines |
| Entering costs | One planned amount for each pay | Weekly, fortnightly, monthly, quarterly or yearly costs, converted for you |
| Planned vs actual | Planned, actual, difference and an under, on track or over note for each category | The same, plus % used, a status and the biggest differences over budget ranked |
| Typing your own spending | Yes | Yes, in a dedicated yellow column |
| Views | One pay cycle at a time | Whole statement period, or an average per week, fortnight or month |
| Transaction import | Not included. You type your actual spending. | Optional import of up to 800 transactions, months worked out for you, fix prompts, Gift received, housing handling and a reconciliation panel |
| Savings | A savings amount for each pay and a surplus figure | A SAVINGS GOALS tab with a target, a date, and amounts for each fortnight and week |
| Dashboard | Planned vs actual figures and chart | Money left each fortnight, money coming in, regular spending and savings, and a chart of your budget by category |
| Price | Free | $12.95 one-off, no subscription |
Based on the current Free Fortnightly Budget. Try the free budget first if you want a simpler start.
Budgeting apps are the better choice if you want your bank to sync automatically. If you would rather pay once, keep your data in your own file and skip the bank link, a spreadsheet can work out a lot cheaper over time.
| What matters | Fortnightly Budget Plus | A subscription budgeting app, such as YNAB |
|---|---|---|
| What it costs | $12.95 once | US$14.99 a month, or US$109 a year on the annual plan |
| Over three years | $12.95. You only pay once. | US$327 or more |
| Your bank and your data | Nothing connects to your bank, so there is no bank login to share. Your data stays in your own Excel file. | Apps that sync link your accounts and keep your data online. Frollo is free and uses Open Banking. YNAB has no direct import for Australian banks. |
| Entering your figures | You type them in, or paste rows from your statement. Our free Bank Statement Converter turns a statement PDF into rows ready to paste. | Many apps bring transactions in for you automatically. |
| If you stop paying | There is nothing to stop. You keep the file. | Access ends when the subscription does. |
YNAB prices are from YNAB's own pricing page, in US dollars plus tax where applicable, checked on 13 November 2026, and may change. All other amounts are Australian dollars. Frollo details are from its app listing. Fortnightly Budget Plus is a spreadsheet, not a bank-syncing app.
The free fortnightly budget spreadsheet has 23 categories, planned vs actual for one pay, and a savings amount and surplus, but no transaction import. Budget Plus adds over 30 categories you can rename, costs entered weekly to yearly and converted for you, a view you can switch between your whole statement period and a week, fortnight or month, a SAVINGS GOALS tab, your biggest overspends ranked, and an optional transaction import that works out the months for you, sorts transactions using merchant rules and highlights rows that need a check. Transactions with no matching keyword go into Other for you to review. See the table above.
Budget Plus is designed for Microsoft Excel (.xlsx). It is a safe, standard Excel file with no clunky macros.
No. Importing is optional. You can type your actual spending straight into the yellow "Type your spend here" column on the BUDGET vs ACTUAL tab.
Each transaction description is matched against built-in merchant keywords, and any keywords you add on the OPTIONAL - CATEGORY RULES tab are checked first. Rows that need a decision, such as credits, possible mortgage transfers, insurance payments and BPAY payments to unknown billers, are highlighted in amber. Anything with no matching keyword goes to Other, and you can add a keyword to sort it correctly next time.
Add a short keyword from the merchant name on the OPTIONAL - CATEGORY RULES tab and pick the category. It fixes that payment and every future import.
It shows your actual spending totals for the dates you imported. You can switch at any time to an average per week, fortnight or month.
Yes. Rename any category on the Budget tab, and use the spare lines for anything that is missing.
No. Nothing connects to your accounts. Your data stays in your own file.
No. This is an educational budgeting tool, not personalised financial advice.
You pay through Stripe's secure checkout. Once payment is confirmed, you are taken to a page with your download link, and a copy is emailed to the address you used at checkout (check your junk or promotions folder if it does not arrive). The download is a ZIP file containing the .xlsx workbook, so unzip it first. The START HERE tab then walks you through setup.
Yes. Choose your pay cycle (weekly, fortnightly or monthly). Each cost can be weekly, fortnightly, monthly, quarterly or yearly, and the spreadsheet converts it for you. If yearly costs like car rego or insurance are the tricky part, see how to budget for annual bills in Australia or how sinking funds work. If you are paid fortnightly but your bills are monthly, see how to budget fortnightly when your bills are monthly. To see how to read the comparison between what you planned and what you spent, see budget vs actual: how to track what you spend.
You can download it, store a copy, edit it for your own use and use it within your own household. You may not resell it, share the original file, or upload it anywhere else. Use with clients, in a business or in a school needs written permission. See the template licence.
Email hello@moneydetective.com.au. Basic support covers access, setup and using the spreadsheet. It does not include personalised budgeting or financial advice.
Because it is a digital download supplied straight after payment, we do not generally offer refunds if you change your mind or no longer need it. If the file cannot be downloaded, is corrupted, does not match its description or does not work as described, email hello@moneydetective.com.au. We may first offer troubleshooting, a replacement file or a corrected version, and if there is a major failure you may be entitled to a refund. This does not limit your rights under the Australian Consumer Law. Read the full Refund Policy.
That is what Payday Buffer is for. Budget Plus looks at your budget and actual spending over each fortnight, while Payday Buffer shows what may be safe to spend until your next payday.
One Excel workbook for your fortnightly budget, actual spending and savings goals.
Get Budget Plus for $12.95 →