
The 3-Minute Budget is an Excel template for people who hate budgeting. Paste in your bank statement and it sorts your money into rent or mortgage, bills, debt, spending and savings, with one number for what you had left. No bank login needed. If you like, add a plan on the Budget tab: your pay, a partner's income, a spending plan, savings goals and debts.
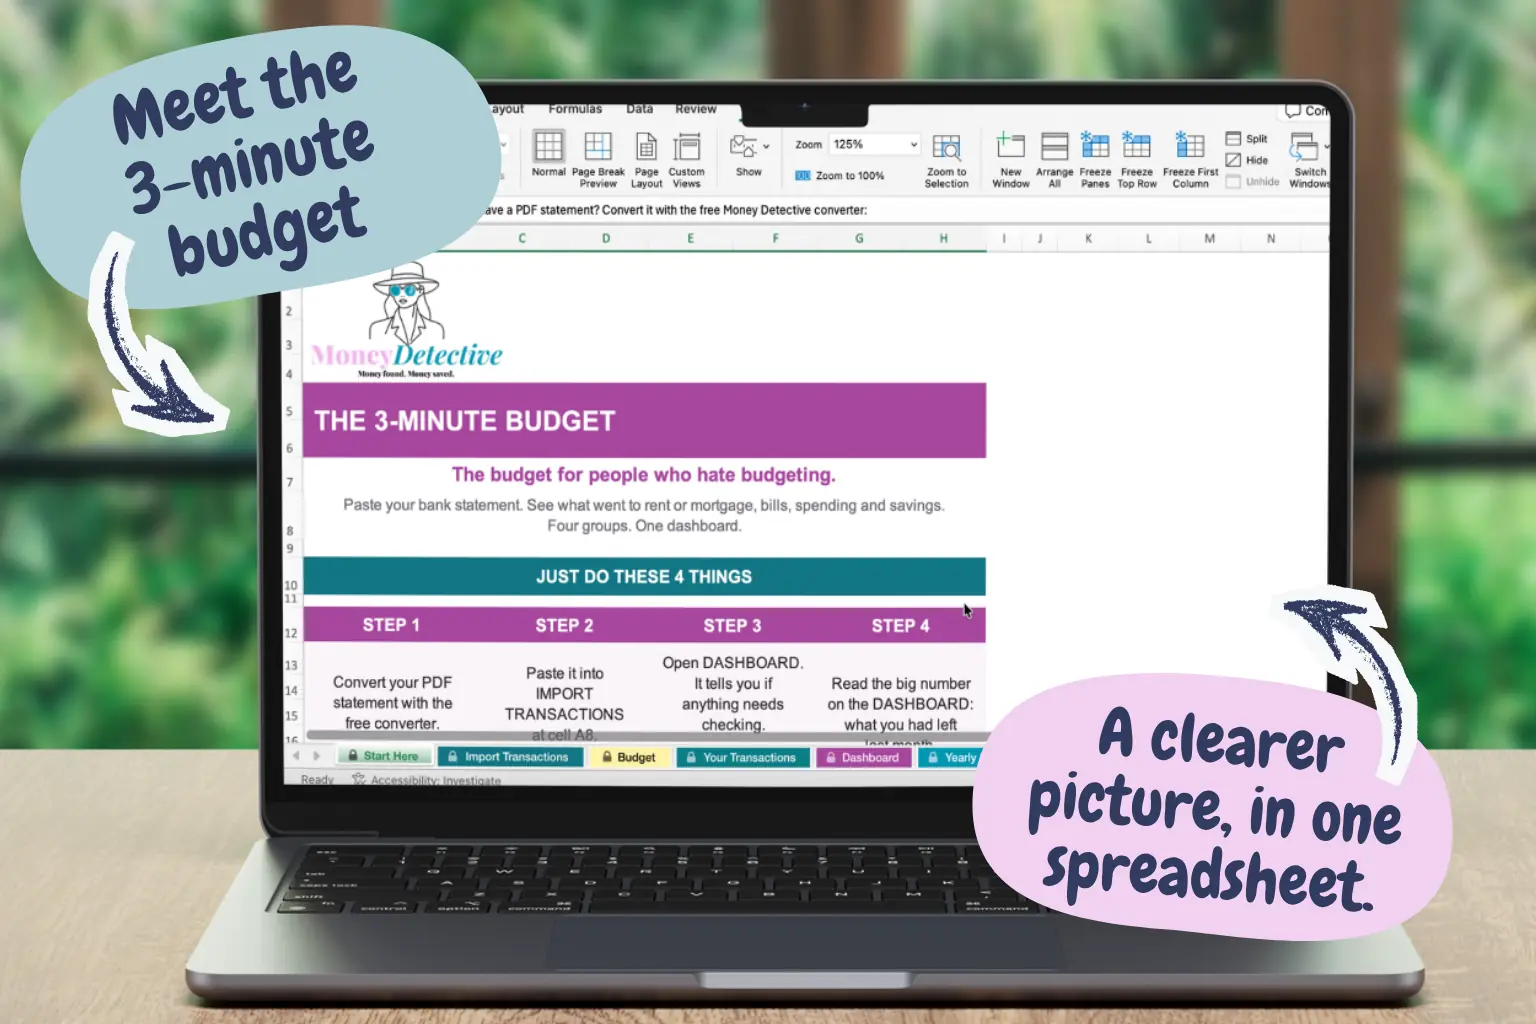
Paste in what you already have. The workbook does the sorting and the adding up.
The Dashboard tells you in plain English what you had left last month, or by how much you went over. It also shows your average month and where each dollar went.
Your biggest cost is tracked separately from your other bills, so you can see how much of your income it takes.
More than 1,300 Australian shop and biller names are built in. Anything it does not recognise is flagged for you to check, and is still counted so nothing goes missing.
Use the income found in your statement, or type in your own pay. Add a partner's income and any side hustle or Uber income, and it all flows into your Dashboard total.
List up to five things you are saving for, how much and how often. The Dashboard shows your goal next to what you actually put away.
The Yearly Snapshot turns your regular costs, savings goals and income into weekly, fortnightly, 4-weekly, monthly, quarterly and yearly amounts. Handy when your bills come in different rhythms.
On the optional Budget tab, plan up to 24 spending lines. Each shows your plan, what your statement says, the difference, and whether you are over, under or on track.
Loan repayments show as Debt on the Dashboard instead of sitting inside Bills or Spending. List up to six debts for a rough estimate of when each could clear.
Change a single transaction from a dropdown, or add a Category Rule so every matching transaction, now and on later imports, is sorted your way.
Twelve categories sounds thorough, but it's also twelve decisions every time you spend something.
Red numbers and stern alerts make budgeting feel like a punishment, not a tool.
The most detailed budget in the world is useless if it's too much friction to actually keep using.
Convert a PDF statement with the free Money Detective converter, then paste it in. Income, transfers and shops are sorted for you.
If any transactions need a second look, the Dashboard tells you. Everything else is already sorted for you.
The Dashboard shows what you had left last month, and where each dollar went.
Want more? The optional Budget tab lets you add your pay, a partner's income, a spending plan, savings goals and debts. The Dashboard shows your debt plan and savings goal next to what you actually paid and saved, and the Yearly Snapshot turns it all into weekly, fortnightly, monthly and yearly amounts.
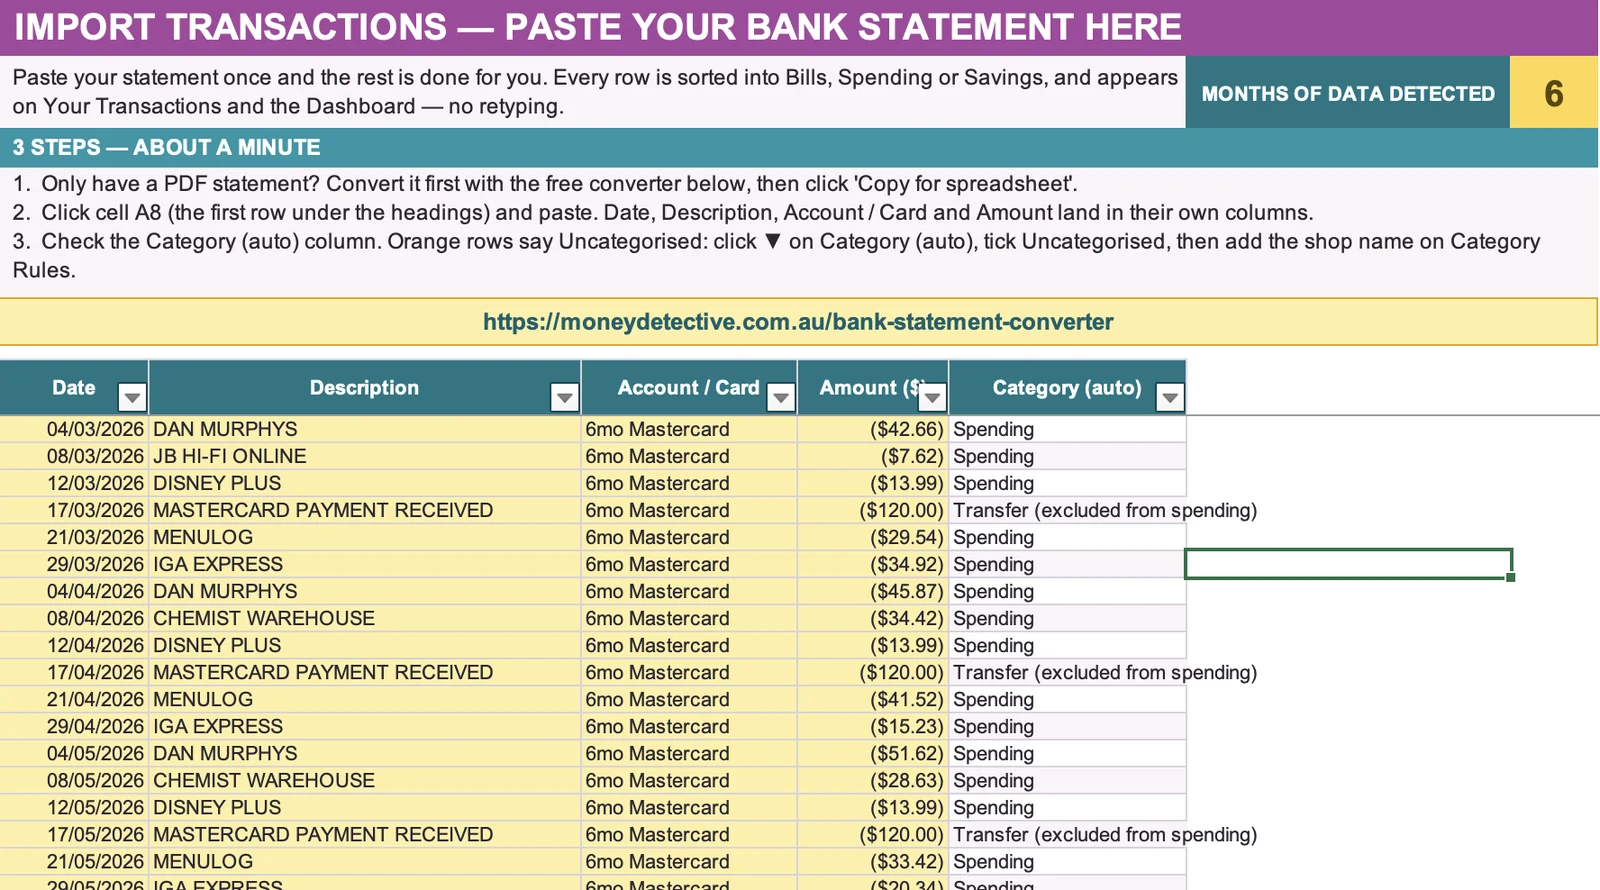
Date, description, account and amount land in their own columns. Categories, income and transfers between your own accounts are worked out for you.
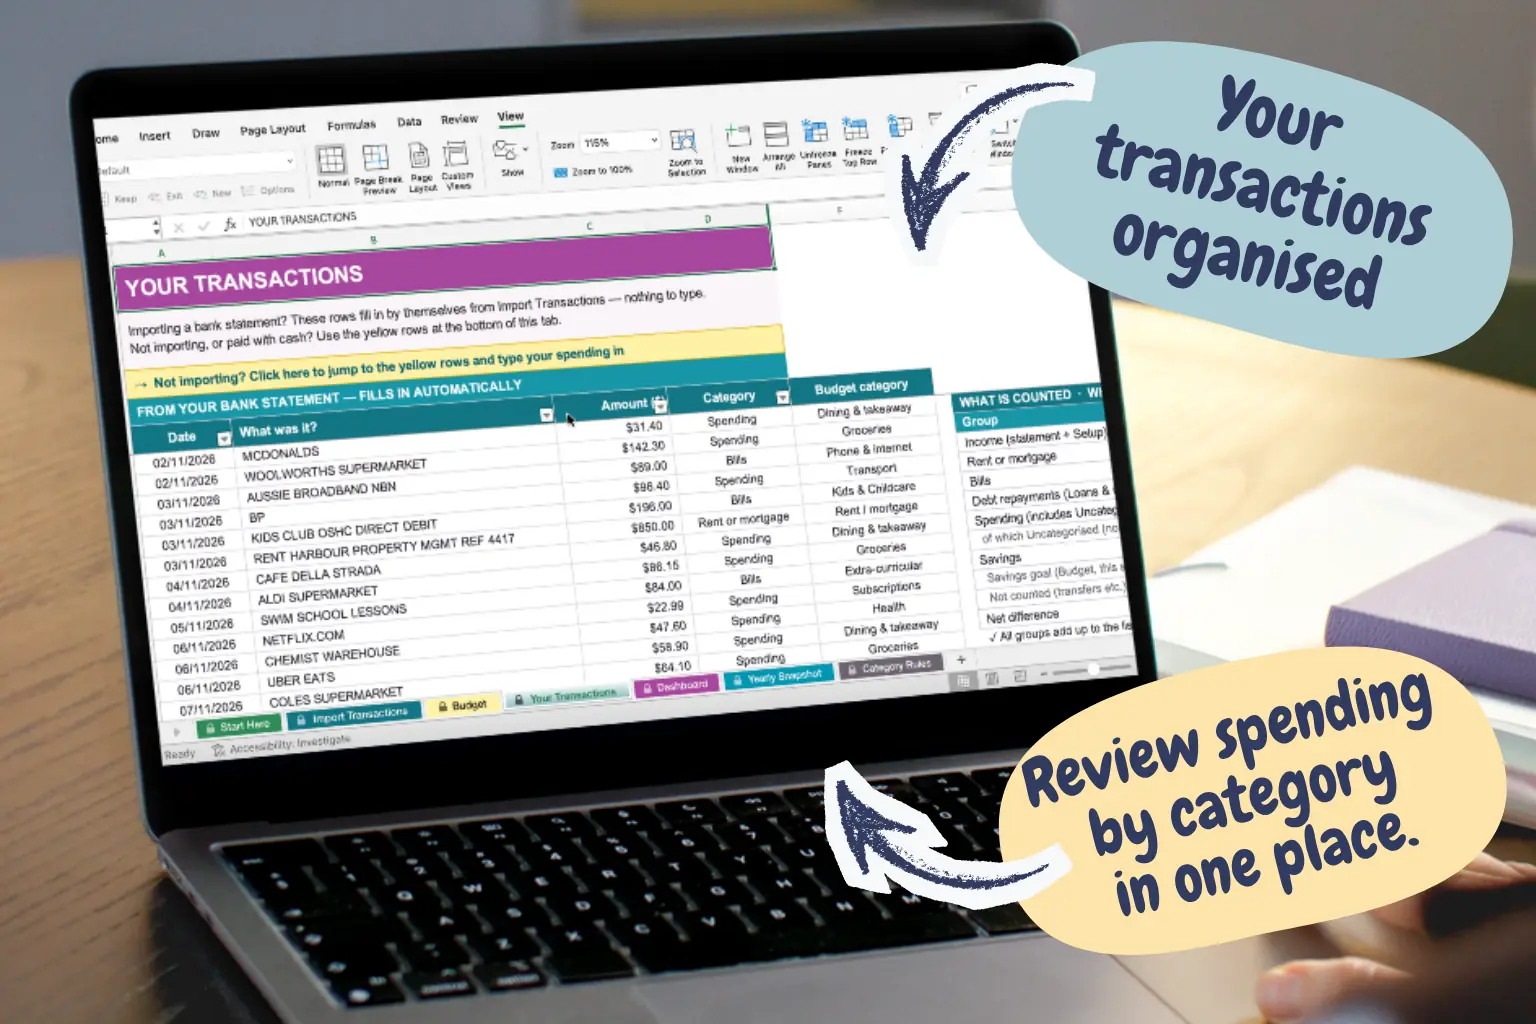
Every transaction sorted into Rent or mortgage, Bills, Spending or Savings, filled in for you. Paid cash or not importing? Type it into the yellow rows at the bottom.
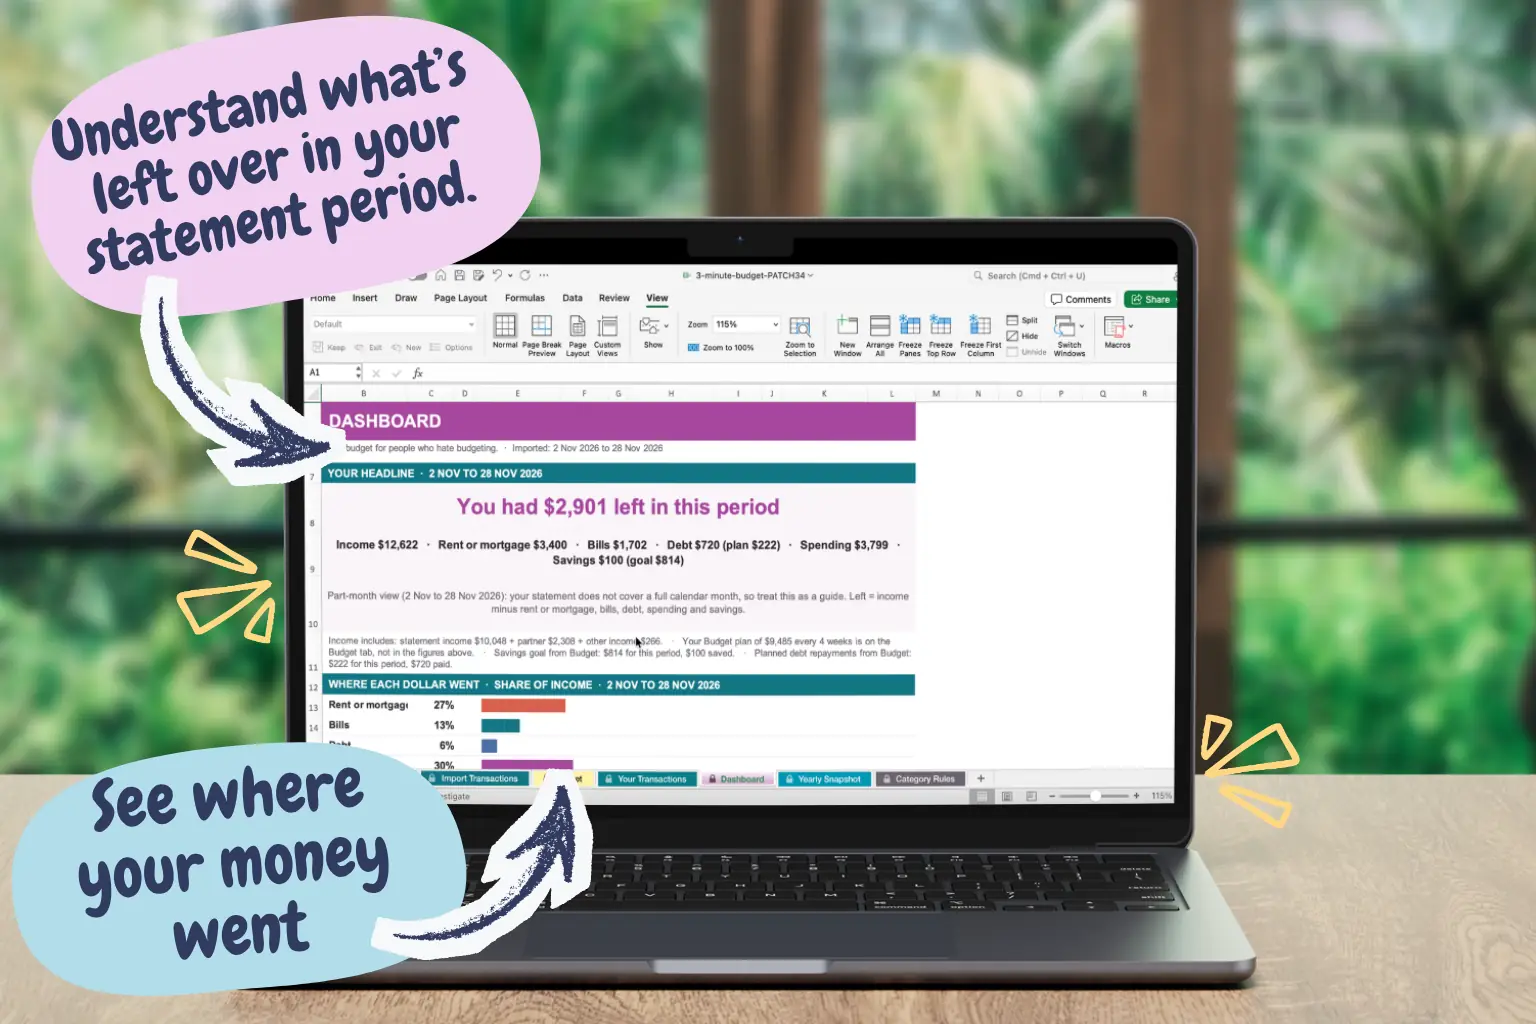
A plain-English headline for your latest full month (or your whole statement if it is shorter), plus where each dollar went across rent or mortgage, bills, debt, spending and savings. Screenshots show sample data.
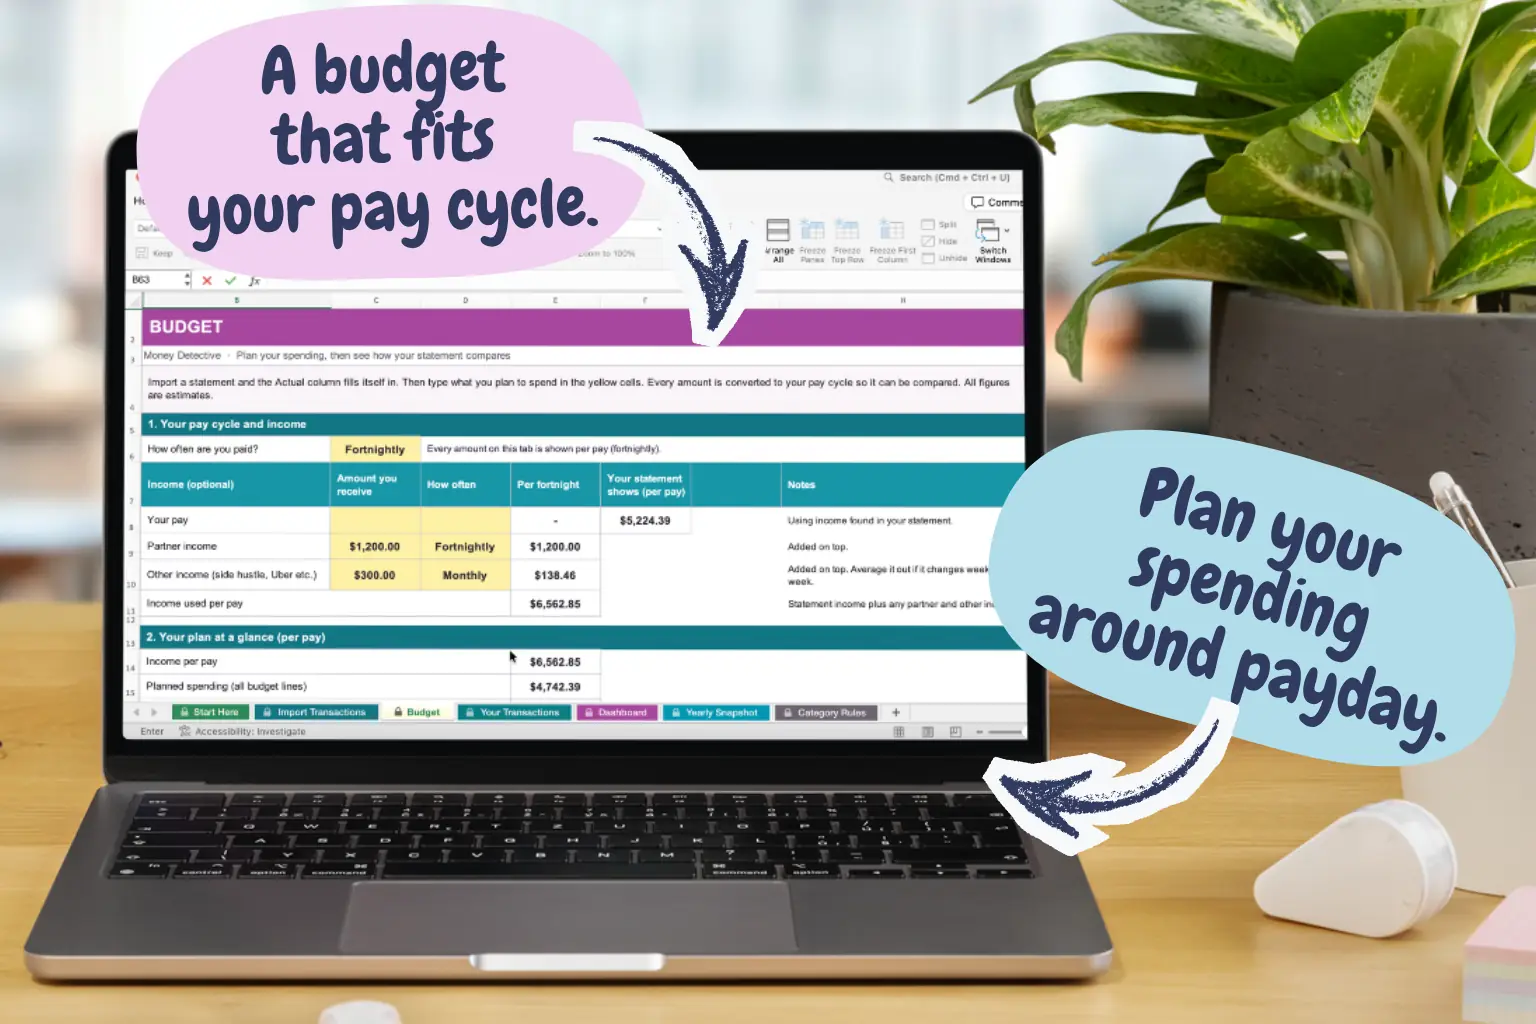
Choose how often you are paid, add your income and a partner's, then plan your spending, savings goals and debts. Each plan line is shown next to what your statement says, as an estimate.
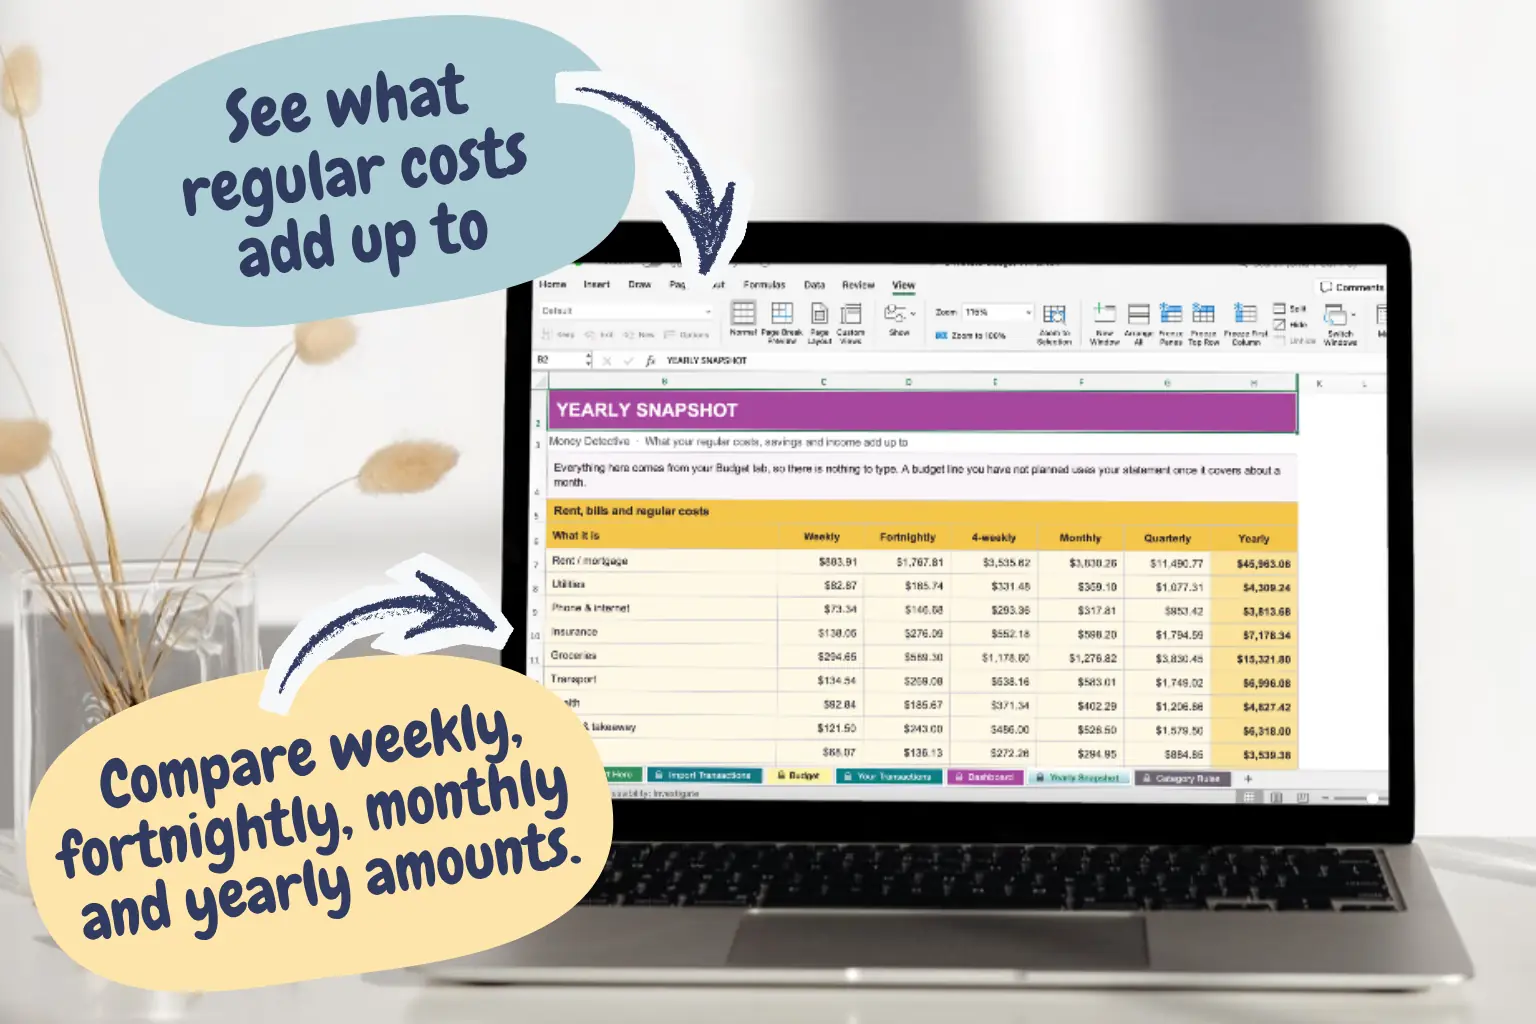
Your regular costs, savings goals and income as weekly, fortnightly, 4-weekly, monthly, quarterly and yearly amounts. Nothing to type: it reads from your Budget tab.
These transactions are illustrative and were made up to show how the template works. They are not real customer data or results. Pasted into Import Transactions, they are sorted like this.
| Date | Description | Amount | Sorted as |
|---|---|---|---|
| 1 Oct | SALARY SAMPLE EMPLOYER | +$4,200.00 | Income |
| 2 Oct | Rent Payment | −$1,500.00 | Rent or mortgage |
| 5 Oct | AGL Energy | −$120.00 | Bills |
| 7 Oct | Telstra | −$85.00 | Bills |
| 8 Oct | Woolworths 1234 | −$165.40 | Spending |
| 12 Oct | Netflix | −$16.99 | Spending |
| 14 Oct | Shell Coles Express | −$70.00 | Spending |
| 18 Oct | Woolworths 1234 | −$142.30 | Spending |
| 20 Oct | TRANSFER TO SAVINGS ACCOUNT | −$400.00 | Savings |
| 22 Oct | Cafe Bella | −$18.50 | Spending |
| 25 Oct | ZQ TRADING 4471 | −$64.00 | Uncategorised: flagged to check (still counted as Spending) |
| 28 Oct | INTERNAL TRANSFER | −$300.00 | Transfer between your own accounts: left out so it is not counted twice |
| 31 Oct | Chemist Warehouse | −$32.20 | Spending |
$1,586 is what was left after rent or mortgage, bills, spending and the $400 already moved to savings. This sample has no loan repayments. If it included a $350 car loan, the Dashboard would show $350 on its own Debt line, take it out of Bills so it is not counted twice, and show $1,236 left. If you add a savings goal on the Budget tab, the Dashboard shows it next to the $400 you actually moved. The Dashboard would also note that 1 transaction needs checking. Figures come from the template's own calculations on the sample rows above, rounded to the nearest dollar.
If a description is not on the built-in list, the row shows as Uncategorised and is highlighted, and the Dashboard tells you how many need a look. They are still counted in your totals (money out as Spending, money in as Income), so nothing goes missing while you sort them out.
There are two ways, and you can use both.
Category Rules also holds the built-in list of more than 1,300 shop and biller names. Every description is checked against the list and the first match wins. Your own words are checked first, so they win over the built-in ones. Keep the word specific, because a short word can match more than you meant.
The Dashboard shows a plain-English headline for your latest full month, from the 1st to the last day. If your statement covers less than a month, it shows the whole statement instead and tells you so. Underneath you see where each dollar went as a share of income (rent or mortgage, bills, debt, spending, savings and what is left), a chart, your average month and how many transactions need checking. If you set a debt plan or a savings goal on the Budget tab, it appears in brackets next to what you actually paid or saved.
Choose how often you are paid, then type your own pay if you would rather use it than the income found in your statement, plus a partner's income and any other income such as a side hustle or Uber. These can be weekly, fortnightly, 4-weekly or monthly, and they flow into your Dashboard income total.
Your plan is not added to the actual spending figures from your statement. Only the income you enter is added to your Dashboard income.
The Yearly Snapshot shows your regular costs (rent or mortgage, bills, loan repayments and the rest), savings goals and income as weekly, fortnightly, 4-weekly, monthly, quarterly and yearly amounts, plus what is left after regular costs and savings. There is nothing to type on it. It reads from your Budget tab, uses your statement for any line you have not planned once it covers about a month, and uses your statement income unless you fill in your own pay.
These are estimates, not forecasts. A short statement is scaled up to a year, so treat those figures as a guide. This is general budgeting information, not financial advice.
The 3-Minute Budget shows where last month's money went and lets you compare it with a simple plan. These are separate Money Detective spreadsheets for other jobs.
The free Fortnightly Budget is a free Excel budget template that plans what each pay needs to cover. It is free with a Money Detective newsletter sign-up.
Fortnightly Budget Plus is an Excel fortnightly budget planner that adds percentage used, a ranked list of your biggest overspends and savings goals with target dates.
The Household Bill Tracker spreadsheet is built for tracking due dates and renewals on your regular bills.
Money Detective grew out of something much more ordinary: managing the bills, renewals, paydays and rising costs of an Australian household. I'm not a financial adviser or accountant. I build practical tools that make the numbers easier to understand and decisions easier to make.
Yes. It is an Excel workbook (.xlsx), designed for Microsoft Excel.
That's the point. The Dashboard keeps to a few headings: rent or mortgage, bills, debt, spending and savings. Fewer headings means fewer decisions, which makes it easier to keep using. The Budget tab is there if you want more detail, and it is optional.
No. You paste in your own bank statement and it sorts your transactions automatically. Only have a PDF? The free Money Detective statement converter turns it into rows you can paste. Paid with cash? Type it into the yellow rows on Your Transactions.
It is designed for a computer, where you copy your statement and paste it into Excel.
Yes. On the optional Budget tab you can add your own pay, a partner's income and other income such as a side hustle or Uber. They flow into your Dashboard income total. If you leave your own pay blank, the income found in your statement is used.
On the optional Budget tab, type what you plan to spend on any of 24 lines. Each line shows your plan next to what your statement says, converted to your pay cycle, with the difference and a status of over, under or on track. The statement figure is an estimate scaled from the dates you imported.
In a basic way. Loan repayments in your statement sort to Loans and Credit Cards and show on the Dashboard as Debt. On the Budget tab you can list up to six debts with the balance, interest rate and repayment, and get a rough estimate of how long each would take to clear if you keep paying the same amount. It assumes a steady repayment and interest rate and no new purchases, so check with your lender. For snowball or avalanche comparisons, see the Debt Payoff Planner.
It shows your rent or mortgage, regular costs, savings goals and income as weekly, fortnightly, 4-weekly, monthly, quarterly and yearly amounts, so you can see what each adds up to over a year. The figures are estimates based on your Budget tab and what is in your statement.
It means every four weeks, which happens 13 times a year. You can pick it as your pay cycle or as how often a cost happens on the Budget tab, and the Yearly Snapshot has a 4-weekly column so it lines up.
To change one transaction, pick a new category from the dropdown in the Change category column on Import Transactions. To fix every matching transaction, including future imports, type a word from the description into a yellow box on Category Rules and pick the category you want. Unrecognised descriptions show as Uncategorised and the Dashboard flags them, and they are still counted while you sort them.
There is room for up to 800 pasted transactions on Import Transactions. The Dashboard works with any length of statement. It shows your latest full month, or your whole statement if it is shorter. Your average month needs about a month of data.
No. The Complete Toolkit bundles six other Money Detective spreadsheets. The 3-Minute Budget is sold separately. See what is in the Toolkit.
No. This is an educational budgeting tool, not personalised financial advice.
You get immediate access to the downloadable file and a short setup guide.
One dashboard, one number that matters.
Get the 3-Minute Budget for $6.95 →